- Posted on : December 27, 2018
-
- Industry : Corporate
- Type: Blog

By Sameer Salunke, Technology Lead, Infogain
One of the most common problems faced by all developers is troubleshooting applications. It takes a lot of time to find out a root cause and other issues within the web application. While it is easy for a developer to write a code and debug the application locally (on their machine) and will help them to overcome a hurdle to move forward, this method is not recommended when the ones’ application is in production. In a production environment, local debugging does not help in determining the problem or its cause.
Normally in an on-premise deployment, one can RDP into the server and open the app logs or IIS logs or even look at the event logs to establish a cause for what went wrong. But, this is not feasible for an application deployed on Azure Cloud.
So, gear up, because this article helps you identify and figure out how to access different types of Azure logging. Think of this article a cheat sheet to help you find logs for your application, IIS, Failed Request Tracing, and etc.
These are different log types you can get for your Azure Web App:
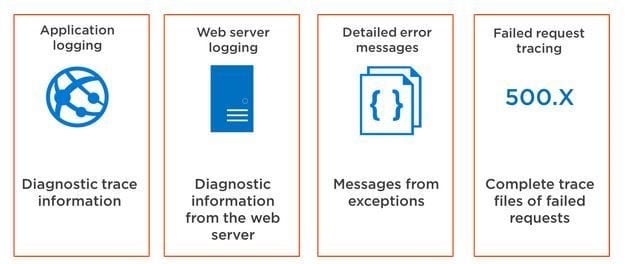
- Application Logs – These are the logs coming being pulled from Application/Service/Website/WebJob. (Detailed information on ‘application logs’ in the article ahead).
- Web Server Logging – Also known as ‘http logs’ or ‘iis logs’, the Web Server Logging will log all requests to your website in W3C Extended Log File Format.
- Detailed Error Messages – Detailed version of the html files are produced when your website responds with an error message. This log type is good to enable debugging for some error responses on your website and is stored on the website’s file system.
- Failed Request Tracing or FREB – This will get you a lot of information from IIS through its different stacks for each failing request. These log files are also stored in the website’s file system but you can get some more information about FREB here.
- xml – You see this file sometimes under the LogFiles directory of your website (d:\home\LogFiles). This file contains ETW designated events and is usually generated and populated with errors of crashes that may have occurred earlier.
- Kudu Traces – These can be found in the website’s file system under d:\home\LogFiles\kudu\trace. Kudu drives some of the developer experience features of Azure Web Apps like: git deployment and WebJobs.
Log files stored in the website’s file system will show up under d:\home\LogFiles.
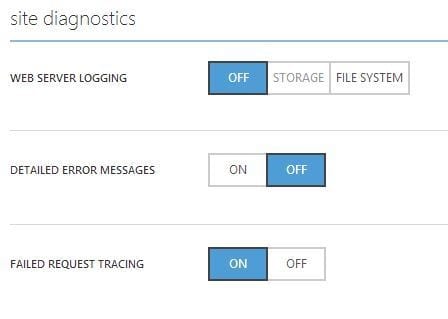
Setting different logs in the Azure Portal
Application Logs
These are the logs coming from your Application/Service/Website/WebJob.
Application Logs for Websites: If you’re using ASP.NET it’s simple to write application logs, just use the Trace class, for example:
Trace.WriteLine(“Message”); // Write a verbose message
Trace.TraceInformation(“Message”); // Write an information message
Trace.TraceWarning(“Message”);
Trace.TraceError(“Message”);
In the Azure portal, you can direct different verbosity levels to different targets simultaneously. The targets are: file system, Azure table storage, and Azure blob storage.
For example, you can have all Information level (and up including Warning and Error) logs go to Azure table storage and all logs (including Verbose and up) go to blob storage.
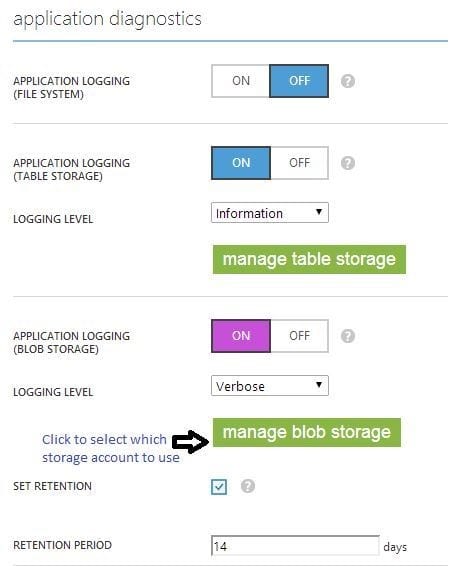
Setting Application Logs in Azure Portal
For node.js websites, the way to write application logs is by writing to the console using console.log(‘message’) and console.error(‘message’) which goes to Information/Error level log entries. Currently, the only supported target for the log files for node.js is the file system.
Other web site types like PHP and Python are not supported for the application logs feature.
Application Logs for WebJobs
Triggered (Scheduled/On Demand)
Whatever is written to console output and console error will go to a log file for the specific triggered webjob run. You can see it on the WebJobs dashboard but the file itself is located under d:\home\data\jobs\triggered\{jobname}\{jobrunid}.
Continuous
Whatever is written to console output and console error will go to the application logs as log entries with log level Information/Error. The first 100 log entries when the continuous WebJob starts will also show up in the continuous WebJob log file that is available on the WebJobs dashboard.
The file itself is under d:\home\data\jobs\continuous\{jobname}.
.NET WebJobs
If you’re using .NET console application as your WebJob, you can follow the same guideline as for an ASP.NET website. Once you use the Trace class, your traces are handled as application logs (including triggered WebJobs).
Application Logs Fields
Here is the list of fields each application log entry consists of:
- Application Name – The website name.
- Date Time
- Level – Log level.
- Event Id
- Instance Id –A unique id for the VM running the website where the log entry came from.
- Instance Id –
- Process Id
- Thread Id
- Activity Id –The current (at the time of the log) activity id.
- Message
There are a couple differences between logs stored in file system, table storage, and blob storage:
Blob storage – Stored as a .csv file with the following structure: Timestamp(DateTime), Level, ApplicationName, InstanceID, Timestamp(Ticks), EventID, ProcessID, ThreadID, Message, ActivityId
Table storage – Each log entry is stored as a table entity, with a Partition Key that is the log’s date (formatted as “YYYYMMDDHH”) and a Row Key which is an ordered GUID to help get the logs in the same order as they happened.
File system – Has a subset of the fields mentioned in the following format: {Date} PID[{Process ID}] {Event Type} {Message}
Using the Activity Id
The activity id field can be very powerful. It can help you correlate all log entries which came from a single request.
The easiest way to use it is to enable Failed Request Tracing on the Azure portal. This will have a side-effect of setting an activity id for each request your website receives where the activity id will propagate to all your application logs.
The actual proper way to set the activity id would have been using this code in the global.asax.cs file:
public class MvcApplication : System.Web.HttpApplication
protected void Application_BeginRequest()
System.Diagnostics.Trace.CorrelationManager.ActivityId = Guid.NewGuid();
But since ASP.NET is doing some funky things, the activity id may get lost (become empty) when using async operations.
Note that the same activity id concept would work for .NET WebJobs. For that, you should use: System.Diagnostics.Trace.CorrelationManager.ActivityId = Guid.NewGuid(); before an operation that requires an activity id.
Retention Policies
File system
Log files will have some retention policy for each type:
- Web server logs have a maximum size per log file and per sum of all log files (which is configurable in the Azure portal).
- Similar for application logs, each log file can get up to 128 KB and the total size of all log files will go up to 1 MB after that old files are removed.
- Detailed error messages and FREB have a maximum amount of files (each file consists of a single error).
Blob storage
Web server logs and application logs stored in blob storage can be configured with a retention policy for deleting log files older than X days.
Analyzing the Diagnostics Logs
Above section we have seen where to find logs and how to configure them, now let us see what and how these logs look.
Application Logging
Application logging contains just that: application logging. This logs everything that you write out with System.Diagnostics.Trace, like Trace.WriteLine(“Message”);. These logs come in .txt format and also contain generic information that your application spits out, like uncaught exceptions, so these Azure trace logs are valuable.
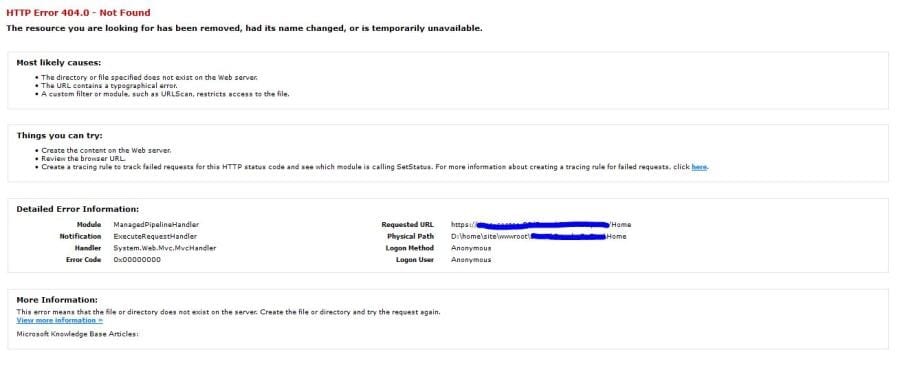
Detailed Error Messages
The logs capture any HTTP code that indicates failure, like HTTP 500 (Internal Server Error) or HTTP 400 (Bad Request) or HTTP 404 – Not Found. These logs come in .htm format and look like this:
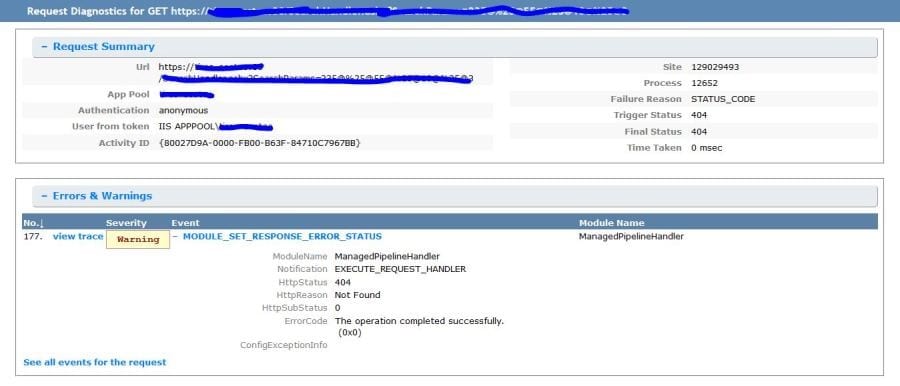
Failed Request Tracing
These logs are very, very detailed. Too detailed for most usage. But if you need to go deep and want to inspect every aspect of the lifecycle of a failed HTTP request, then this is the log you are looking for. They come in .xml format that has a special schema (freb.xsl). When you open them in Internet Explorer (from a directory that also contains the freb.xsl file), they look like this:
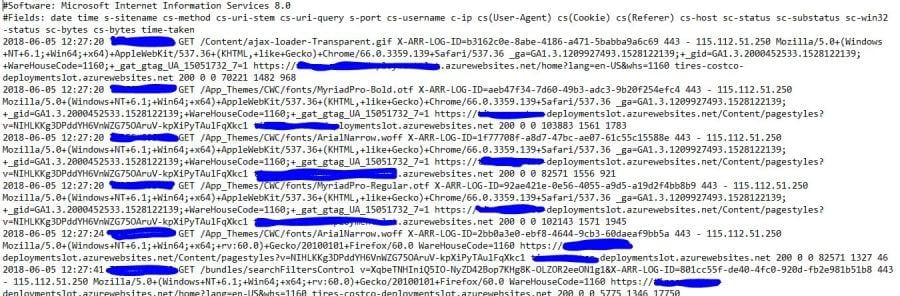
Web Server Logging
These logs contain the raw HTTP data, just like normal IIS logs. They contain each HTTP request in detail, the browser agent information, and the IP address of the requestor. Your Azure IIS logs come in .log format and look like this:
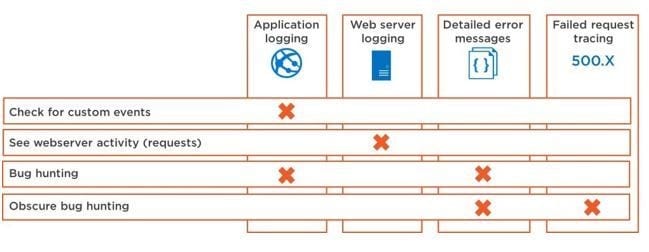
What to use when?
These logs can help you to troubleshoot your application, but which log types can you use best in which situation? The illustration below provides some high-level guidance: